Groundwater Depletion in India -Now it’s Time to be Conscious
09/09/2016
Juthika Dey*
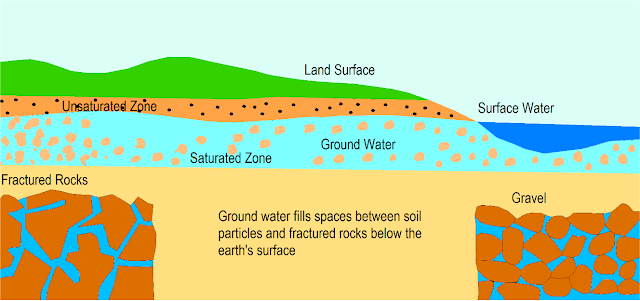
Ground water is the water that seeps through rocks and soil and is stored below the ground. The rocks in which ground water is stored are called aquifers. Aquifers are typically made up of gravel, sand, sandstone or limestone. Water moves through these rocks because they have large connected spaces that make them permeable. The area where water fills the aquifer is called the saturated zone. The depth from the surface at which ground water is found is called the water table. The water table can be as shallow as a foot below the ground or it can be a few hundred meters deep. Heavy rains can cause the water table to rise and conversely, continuous extraction of ground water can cause the level to fall.
The underground (hydro -geological) setting of ground water defines the potential of this resource and its vulnerability to irreversible degradation.1 This setting in India can be divided into following categories, which are described below:

 2013 2016
The depth to water level map of January 2016 for the country indicates that in general depth to water level ranges from 2 to 10 m bgl as observed at about more than 65% of the monitoring stations. Sub-Himalayan area, north of river Ganges, northern parts of Uttar Pradesh, northern parts of Bihar, Odisha, Assam, Andhra Pradesh, coastal parts of Maharashtra, and Tripura generally the depth to water level varies from 2-5 meter below ground level. Shallow water level of less than 2 m bgl is observed in the states of Assam and isolated pockets in Andhra Pradesh, Maharashtra, Odisha and Tamil Nadu. In West Bengal water level generally varies from 2 to 10 m bgl and central parts of the state shows water level of 10 m and above and deeper water level of more than 20 m bgl in small pockets.
In major parts of north-western states depth to water level generally ranges from 10-40 m bgl. Water level of more than 40 m bgl is also prevalent in the north western part of the country. In the western parts of the country deeper water level is recorded in the depth range of 20-40 m bgl and more than 40 m bgl. In some parts of Haryana, and Delhi and almost major parts of Rajasthan, water level of more than 40 m bgl is recorded. Along the eastern coast water level is generally upto 5 m bgl whereas in the western coast water level of 10 m bgl is prevalent. . The peninsular part of country generally recorded a water level in the range of 2 to 20 m bgl depth range.
Decadal Mean of Water Level Fluctuation in India
The decadal water level fluctuation map of India for January, 2016 with the mean of January (2006-2015) is shown in fig -7and frequency distribution of fluctuation ranges is shown. As observed in map, almost whole country is showing decline in water level, maximum fall is observed in and around parts of Rajasthan, Haryana, Punjab, Gujarat, Telangana, Maharashtra, Uttar Pradesh, Bihar, Chhatishgarh, Jahrkhand and West Bengal. A rise in water level is observed in few states but occurs sporadically.

Decline in water level of more than 4 m is mostly prominent in the states of Andhra Pradesh, Chhatishgarh, Delhi, Gujarat, Haryana, Karnataka, Madhya Pradesh, Maharashtra, Punjab, Rajasthan, Telangana and West Bengal. Rise in water level of more than 4 m is also observed in few states in isolated pockets such as Gujarat, Himachal Pradesh, Rajasthan and Tamil Nadu.
Top 4 States in Which Ground Water Depletion is in Alarming Condition
1. Uttarpradesh
Depth to Water Level - January - 2016
During January 2016, in Uttar Pradesh shallow water level ranging between 0 and 2 m bgl were observed at only 3% of the wells monitored mostly seen as small patches. Water level ranging between 2 and 5 m bgl was observed at 33% of wells, covering the entire northern and central part of the state. The depth to water level between 5 and 10 m bgl has been observed in 40 % wells and depth to water level between 10 and 20 meters is observed at 21% of wells. Deeper water levels of more than 20 m bgl are observed at 3% stations and occur as patches along western boundary of the state. The depth to water level in the state ranges upto 37.50 m bgl in Etawah district.
Main Causes of Groundwater Depletion in Uttar Pradesh
Polluting Industries
The NGT ordered closure of Bhushan Steel and Strips Ltd in Ghaziabad, Uttar Pradesh for 4 weeks declaring it to be a polluting industry that is contaminating the ground water and extracting high quantity of ground water for industrial use without permission from the CGWA. An NGO testing the ground water in 2011 in Ghaziabad also found alarmingly high amounts of carcinogenic hexavalent chromium in the groundwater in at least three areas – in both the trans- and sis- Hindon parts of the city.
The Central Pollution Control Board (CPCB) told the NGT on November 20, 2015 that large amounts of industrial effluents have been found in the groundwater and rivers flowing through several districts of Uttar Pradesh.
Irrigation
In Uttar Pradesh 4.2 million tubewells, 25,000 deep wells and 30,000 government tubewells, are exhausting groundwater resources for irrigation, according to the UP irrigation department. About 70% of the irrigation water comes from groundwater sources. The groundwater is being drawn way faster than it is recharged. Ruthless deforestation and modification of hill slopes in catchment areas, systematic neglect of local water systems, wetlands and rivers, excessive use of fertilizers and tractors, making the sub-soil less porous have all led to less water percolating through the soil.
Sugar Cane Plantation
Sugarcane crushing and processing is an extremely water intensive process. Average water consumption of a factory stands at 14 lakh litres each day.
2. Rajasthan
Depth to Water Level - January 2016
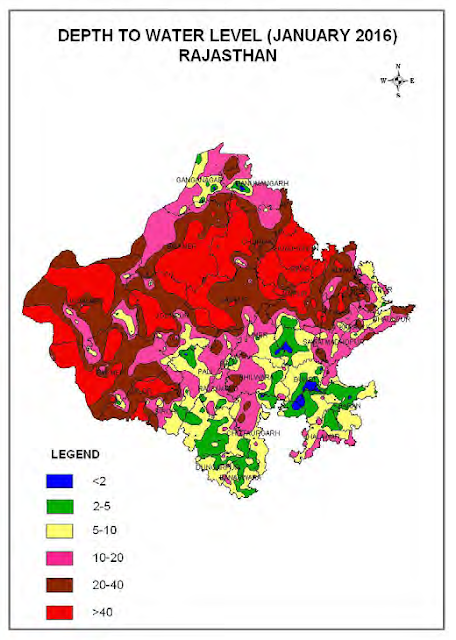
During January 2016, it is observed that only 4% wells in Rajasthan have shown water level in the range of 0-2 m bgl, 14% of the wells have shown water level in the range of 2-5 m bgl. About 22% of the wells analyzed have shown water level in the range of 5-10 m bgl, 24% of the wells have shown water level in the range of 10-20 m bgl. Deeper water level in the range of 20-40m bgl is observed at 17% of the wells analysed and water level more than 40 m bgl is observed at 19% of the wells analysed. Shallow water levels are recorded in the southwestern parts of the state. Deepest water level is recorded in Bikaner district (119.06).
Main Causes of Ground Water Depletion in Rajasthan
Indiscriminate Use of Ground Water
A section of farmers in the dry districts like Jodhpur, Bikaner and Barmer are growing water intensive unconventional crops, using groundwater indiscriminately even in the months of May and June, which is fast depleting the scarce resource rapidly from the region.
Rainfall Variability
The Western Rajasthan suffers from scarcity of rainfall. The average annual rainfall in the region is measured to be 350 mm per year and above that the rainfall pattern in the region shows large variability.
Temperature Variability
In the Western Rajasthan during last 30 years the temperature has shown a great variability with an over-age rise of about 0.5°C for the month of June. The temperature rose from average temperature of 33.25°Cin 1973 to 33.75°C in 2008. The maximum rise is visibleduring 1995–2000. Whereas for the month of January the average rise in temperature is about 1°C during lasy30 years.
Urbanization
Due to urbanization many natural streams began to be used for dumping garbage. Due to expansion, 150 streams with 113 of 1st order, 37 of 2nd order, and 10 of 3rd order are blocked or have been filled for construction purposes. Consequently, this greatly influences the availability of clean surface water and groundwater recharge.
Destruction of Groundwater Recharge
Groundwater recharge can be greatly impeded due to anthropogenic activities, such as deforestation, destruction of local water systems, stoppage of river flows, and paving/concretization. Deforestation results in the loss of topsoil and thus reduced water infiltration. Increased surface runoff and changes in river flow regimes, also affecting recharge in a given area, are additional results of deforestation. Urbanization and development greatly affects groundwater recharge, as impervious land does not allow water to permeate. As built up area increases and there is more developed land in the form or houses, roads, etc., there is less area available for groundwater recharge.
3. PUNJAB
Depth to Water Level – January 2016
During January 2016, in Punjab, it is observed that in only 5% of the wells, water level ranges in 0-2 m depth range. About 18% of the wells analysed have shown water level in the range of 2-5 m bgl, 22% wells in the range of 5-10 m bgl and a majority of wells i.e. 29% show water levels in the range of 10-20 m bgl and 26% wells have shown water level in the range of 20-40 m bgl. Deeper water level is mostly recorded in districts of Moga, Sangrur, Patiala, Jalandhar. The depth to water level recorded in the state during January 2016 ranges upto 38.57 m bgl.
Main Causes of Ground Water Depletion in Punjab
Government Subsidies
The government has incentivized usage of groundwater by giving subsidies for irrigation equipment and cheap electricity leading to unbridled pumping out of groundwater for irrigation. Owing to the dip in groundwater levels, irrigation has become a challenge and farming is becoming unsustainable. Pumping out the ground water from the ever-deepening water table requires expensive deep tube wells increasing the farming expenses.

Negative Effects of Excessive Irrigation
Punjab, 73 per cent area under agriculture is dependent for irrigation on tube wells, which number approximately 13 lakhs. The over-exploitation of the subsoil water due to the reckless pumping out of the water has led to decline in the subsoil water table. Already, more than 100 blocks have been declared over-exploited. The state is now looking to immediately refurbish its canal network.
4. DELHI
Depth to Water Level – January 2016
The depth to water level recorded in the state of Delhi during January 2016 ranges from 0.74 m bgl to 59.51 m bgl (South District). It is observed that only 6% of the wells have shown water level in the range of 0-2 m bgl. About 18 % of the wells analysed have shown water level in the range of 2-5 m bgl, about 25% of the wells have shown water level in the range of 5-10 m bgl and 27 % wells show water level in the range of 10-20 m bgl. Deeper water level in the range of 20-40 m bgl and more than 40 m bgl are shown by 16% & 8% of the wells analysed respectively. It is observed that Southern parts of Delhi show deeper water levels of more than 20 m bgl.
Main Causes of Ground Water Depletion in Delhi
It’s alarming, but true. Delhi’s groundwater table is receding steadily at a pace that could leave the Capital waging a ‘water war’ for every drop of this precious liquid.
In 1983, fresh groundwater was available at just a little below 33 feet. By 2011, this level had gone below 132 feet, with the most recent decade of 2002-2011 registering the sharpest fall of almost 29 feet.
Increasing Groundwater Withdrawal
The main reasons for decline in groundwater levels in Delhi includes increasing groundwater withdrawal for various purposes, especially in areas where piped water supply is inadequate, and the rapid pace of urbanisation that results in reduced natural recharge of aquifers.

“In Delhi, the groundwater table spread over 1,484 square km has declined between 2 metre and 20 metre, and we are now actually looking at the prospect of a huge water crisis if the situation is not remedied soon. The city needs over 3,324 million litres of water a day (MLD) while it gets just over 2,000 MLD. The average water consumption in Delhi is estimated at 240-litre per capita per day (lpcd), the highest in the country,” added Mr. Jain.
Rapid Rate of Population
Admitting that Delhi has been facing rapid decline in groundwater levels in the recent years, which calls for attention and close watch through monitoring the CGWB in its year book 2011-12, the Board has noted that Delhi’s rapid increase in population, at the rate of 2.1 per cent per annum during the decade 2001-2011, has taken a toll. Delhi has total area of 1,484 sq km, of which fully developed urban area is 525 sq km. With over 14 million inhabitants, the city is bursting at seams.
Less Replenishment of Water
"Construction over the years has affected water recharge as natural drainages have disappeared. Besides, more concrete means less amount of rainwater can seep through the earth," the official said.

From above discussion we can see that there are some states which are in a very dangerous position in their depth of ground water level. Some steps have been taken by the states to recover their situation like Uttarpradesh government take some laws such as “Uttarpradesh Groundwater Conservation, Protection and Development (Management, Control and Regulation) Act, 2010”.
The rapidly declining water level of Delhi is attributed mainly due to rampant urbanization and enhanced groundwater withdrawal and reduction in the available open space for recharge to groundwater. The situation can be improved by adopting rainwater harvesting and artificial recharge to groundwater measures. The Master plan for rainwater harvesting and artificial recharge of NCT Delhi estimated that nearly 440 MCM of rainwater can be harvested annually in Delhi and utilized for artificial recharge to groundwater. The artificial recharge to groundwater can be taken up by adopting 10different measures like rainwater harvesting at the level of individuals, at the level of colonies and by the institutions. The Central Groundwater Board of NCT Delhi has taken up the leadership of spearheading rainwater harvesting in NCT Delhi. The rainwater harvesting effort by CGWB in JNU and IIT campuses resulted in to rise in water level to the tune of about 2 to 3 meters in vicinity of the area where the project was implemented.
To delay the transplanting to save lot of water, as the evapo-transpiration is much less compared to May, at the initiative of the Punjab State Farmers Commission, ‘the Punjab preservation of sub-soil water Act, 2009’ was promulgated as an Ordinance in 2008.
A Rajasthan State Sector Scheme “Artificial Recharge to Ground Water through Dug Wells” of Ministry of Water Resources was implemented in 31 districts of Rajasthan during 2007-2010. Under this scheme, funds to the tune of Rs. 29.80 crore were released through NABARD covering 88753 beneficiaries for construction of dug well recharge structures in their farm land.
References:
*Student, 2016
Part -Time Lecturer in the Department of Geography of Women’s Christian College
Juthika Dey*
Ground water is the water that seeps through rocks and soil and is stored below the ground. The rocks in which ground water is stored are called aquifers. Aquifers are typically made up of gravel, sand, sandstone or limestone. Water moves through these rocks because they have large connected spaces that make them permeable. The area where water fills the aquifer is called the saturated zone. The depth from the surface at which ground water is found is called the water table. The water table can be as shallow as a foot below the ground or it can be a few hundred meters deep. Heavy rains can cause the water table to rise and conversely, continuous extraction of ground water can cause the level to fall.

Source: Overview of Groundwater in India, Rupal Suhag , February,2016
Figure 1: Graphical Representation of Ground Water and Associated Terms
The underground (hydro -geological) setting of ground water defines the potential of this resource and its vulnerability to irreversible degradation.1 This setting in India can be divided into following categories, which are described below:
- Hard-rock aquifers of peninsular India: These aquifers represent around 65% of India’s overall aquifer surface area. Most of them are found in central peninsular India, where land is typically underlain by hard-rock formations. These rocks give rise to a complex and extensive low-storage aquifer system, where in the water level tends to drop very rapidly once the water table falls by more than 2-6 meters. Additionally, these aquifers have poor permeability* which limits their recharge through rainfall. This implies that water in these aquifers is non- replenish able and will eventually dry out due to continuous usage.
- Alluvial aquifers of the Indo- Gangetic plains: These aquifers, found in the Gangetic and Indus plains in Northern India have significant storage spaces, and hence are a valuable source of fresh water supply. However, due to excessive ground water extraction and low recharge rates, these aquifers are at the risk of irreversible overexploitation.
The Depth of Water Level in India 2013 & 2016


Source: Groundwater Monitoring Report, January 2016
Figure 2: depth of water level in India 2013 Figure 3: depth of water level in India
Figure 2: depth of water level in India 2013 Figure 3: depth of water level in India
The depth to water level map of January 2016 for the country indicates that in general depth to water level ranges from 2 to 10 m bgl as observed at about more than 65% of the monitoring stations. Sub-Himalayan area, north of river Ganges, northern parts of Uttar Pradesh, northern parts of Bihar, Odisha, Assam, Andhra Pradesh, coastal parts of Maharashtra, and Tripura generally the depth to water level varies from 2-5 meter below ground level. Shallow water level of less than 2 m bgl is observed in the states of Assam and isolated pockets in Andhra Pradesh, Maharashtra, Odisha and Tamil Nadu. In West Bengal water level generally varies from 2 to 10 m bgl and central parts of the state shows water level of 10 m and above and deeper water level of more than 20 m bgl in small pockets.
In major parts of north-western states depth to water level generally ranges from 10-40 m bgl. Water level of more than 40 m bgl is also prevalent in the north western part of the country. In the western parts of the country deeper water level is recorded in the depth range of 20-40 m bgl and more than 40 m bgl. In some parts of Haryana, and Delhi and almost major parts of Rajasthan, water level of more than 40 m bgl is recorded. Along the eastern coast water level is generally upto 5 m bgl whereas in the western coast water level of 10 m bgl is prevalent. . The peninsular part of country generally recorded a water level in the range of 2 to 20 m bgl depth range.
Decadal Mean of Water Level Fluctuation in India
The decadal water level fluctuation map of India for January, 2016 with the mean of January (2006-2015) is shown in fig -7and frequency distribution of fluctuation ranges is shown. As observed in map, almost whole country is showing decline in water level, maximum fall is observed in and around parts of Rajasthan, Haryana, Punjab, Gujarat, Telangana, Maharashtra, Uttar Pradesh, Bihar, Chhatishgarh, Jahrkhand and West Bengal. A rise in water level is observed in few states but occurs sporadically.

Source: Groundwater Monitoring Report, January, 2016
Figure 4: Water Level Fluctuation (January 2016 with Mean of January (2006 - 2015)
Decline in water level of more than 4 m is mostly prominent in the states of Andhra Pradesh, Chhatishgarh, Delhi, Gujarat, Haryana, Karnataka, Madhya Pradesh, Maharashtra, Punjab, Rajasthan, Telangana and West Bengal. Rise in water level of more than 4 m is also observed in few states in isolated pockets such as Gujarat, Himachal Pradesh, Rajasthan and Tamil Nadu.
Top 4 States in Which Ground Water Depletion is in Alarming Condition
1. Uttarpradesh
Depth to Water Level - January - 2016

Source: Groundwater Monitoring Report, January, 2016
Figure 5: depth to water level (January 2016) Uttarpradesh
During January 2016, in Uttar Pradesh shallow water level ranging between 0 and 2 m bgl were observed at only 3% of the wells monitored mostly seen as small patches. Water level ranging between 2 and 5 m bgl was observed at 33% of wells, covering the entire northern and central part of the state. The depth to water level between 5 and 10 m bgl has been observed in 40 % wells and depth to water level between 10 and 20 meters is observed at 21% of wells. Deeper water levels of more than 20 m bgl are observed at 3% stations and occur as patches along western boundary of the state. The depth to water level in the state ranges upto 37.50 m bgl in Etawah district.
Main Causes of Groundwater Depletion in Uttar Pradesh
Polluting Industries
The NGT ordered closure of Bhushan Steel and Strips Ltd in Ghaziabad, Uttar Pradesh for 4 weeks declaring it to be a polluting industry that is contaminating the ground water and extracting high quantity of ground water for industrial use without permission from the CGWA. An NGO testing the ground water in 2011 in Ghaziabad also found alarmingly high amounts of carcinogenic hexavalent chromium in the groundwater in at least three areas – in both the trans- and sis- Hindon parts of the city.
The Central Pollution Control Board (CPCB) told the NGT on November 20, 2015 that large amounts of industrial effluents have been found in the groundwater and rivers flowing through several districts of Uttar Pradesh.
Irrigation
In Uttar Pradesh 4.2 million tubewells, 25,000 deep wells and 30,000 government tubewells, are exhausting groundwater resources for irrigation, according to the UP irrigation department. About 70% of the irrigation water comes from groundwater sources. The groundwater is being drawn way faster than it is recharged. Ruthless deforestation and modification of hill slopes in catchment areas, systematic neglect of local water systems, wetlands and rivers, excessive use of fertilizers and tractors, making the sub-soil less porous have all led to less water percolating through the soil.
Sugar Cane Plantation
Sugarcane crushing and processing is an extremely water intensive process. Average water consumption of a factory stands at 14 lakh litres each day.
2. Rajasthan
Depth to Water Level - January 2016
During January 2016, it is observed that only 4% wells in Rajasthan have shown water level in the range of 0-2 m bgl, 14% of the wells have shown water level in the range of 2-5 m bgl. About 22% of the wells analyzed have shown water level in the range of 5-10 m bgl, 24% of the wells have shown water level in the range of 10-20 m bgl. Deeper water level in the range of 20-40m bgl is observed at 17% of the wells analysed and water level more than 40 m bgl is observed at 19% of the wells analysed. Shallow water levels are recorded in the southwestern parts of the state. Deepest water level is recorded in Bikaner district (119.06).
Main Causes of Ground Water Depletion in Rajasthan
Indiscriminate Use of Ground Water
A section of farmers in the dry districts like Jodhpur, Bikaner and Barmer are growing water intensive unconventional crops, using groundwater indiscriminately even in the months of May and June, which is fast depleting the scarce resource rapidly from the region.
Rainfall Variability
The Western Rajasthan suffers from scarcity of rainfall. The average annual rainfall in the region is measured to be 350 mm per year and above that the rainfall pattern in the region shows large variability.
Temperature Variability
In the Western Rajasthan during last 30 years the temperature has shown a great variability with an over-age rise of about 0.5°C for the month of June. The temperature rose from average temperature of 33.25°Cin 1973 to 33.75°C in 2008. The maximum rise is visibleduring 1995–2000. Whereas for the month of January the average rise in temperature is about 1°C during lasy30 years.
Urbanization

Source: Groundwater Monitoring Report, January, 2016
Figure 6: Depth to Water Level - January 2016 (Rajasthan)
Due to urbanization many natural streams began to be used for dumping garbage. Due to expansion, 150 streams with 113 of 1st order, 37 of 2nd order, and 10 of 3rd order are blocked or have been filled for construction purposes. Consequently, this greatly influences the availability of clean surface water and groundwater recharge.
Destruction of Groundwater Recharge
Groundwater recharge can be greatly impeded due to anthropogenic activities, such as deforestation, destruction of local water systems, stoppage of river flows, and paving/concretization. Deforestation results in the loss of topsoil and thus reduced water infiltration. Increased surface runoff and changes in river flow regimes, also affecting recharge in a given area, are additional results of deforestation. Urbanization and development greatly affects groundwater recharge, as impervious land does not allow water to permeate. As built up area increases and there is more developed land in the form or houses, roads, etc., there is less area available for groundwater recharge.
3. PUNJAB
Depth to Water Level – January 2016
During January 2016, in Punjab, it is observed that in only 5% of the wells, water level ranges in 0-2 m depth range. About 18% of the wells analysed have shown water level in the range of 2-5 m bgl, 22% wells in the range of 5-10 m bgl and a majority of wells i.e. 29% show water levels in the range of 10-20 m bgl and 26% wells have shown water level in the range of 20-40 m bgl. Deeper water level is mostly recorded in districts of Moga, Sangrur, Patiala, Jalandhar. The depth to water level recorded in the state during January 2016 ranges upto 38.57 m bgl.
Main Causes of Ground Water Depletion in Punjab
Government Subsidies
The government has incentivized usage of groundwater by giving subsidies for irrigation equipment and cheap electricity leading to unbridled pumping out of groundwater for irrigation. Owing to the dip in groundwater levels, irrigation has become a challenge and farming is becoming unsustainable. Pumping out the ground water from the ever-deepening water table requires expensive deep tube wells increasing the farming expenses.

Source: Groundwater Monitoring Report, January 2016
Figure 7: Depth to Water Level - January 2016 (Punjab)
Negative Effects of Excessive Irrigation
Punjab, 73 per cent area under agriculture is dependent for irrigation on tube wells, which number approximately 13 lakhs. The over-exploitation of the subsoil water due to the reckless pumping out of the water has led to decline in the subsoil water table. Already, more than 100 blocks have been declared over-exploited. The state is now looking to immediately refurbish its canal network.
4. DELHI
Depth to Water Level – January 2016
The depth to water level recorded in the state of Delhi during January 2016 ranges from 0.74 m bgl to 59.51 m bgl (South District). It is observed that only 6% of the wells have shown water level in the range of 0-2 m bgl. About 18 % of the wells analysed have shown water level in the range of 2-5 m bgl, about 25% of the wells have shown water level in the range of 5-10 m bgl and 27 % wells show water level in the range of 10-20 m bgl. Deeper water level in the range of 20-40 m bgl and more than 40 m bgl are shown by 16% & 8% of the wells analysed respectively. It is observed that Southern parts of Delhi show deeper water levels of more than 20 m bgl.
Main Causes of Ground Water Depletion in Delhi
It’s alarming, but true. Delhi’s groundwater table is receding steadily at a pace that could leave the Capital waging a ‘water war’ for every drop of this precious liquid.
In 1983, fresh groundwater was available at just a little below 33 feet. By 2011, this level had gone below 132 feet, with the most recent decade of 2002-2011 registering the sharpest fall of almost 29 feet.
Increasing Groundwater Withdrawal
The main reasons for decline in groundwater levels in Delhi includes increasing groundwater withdrawal for various purposes, especially in areas where piped water supply is inadequate, and the rapid pace of urbanisation that results in reduced natural recharge of aquifers.

Source: Groundwater Monitoring Report, January 2016
Figure8: Depth to Water Level – January 2016, (Delhi)
Over Consumption“In Delhi, the groundwater table spread over 1,484 square km has declined between 2 metre and 20 metre, and we are now actually looking at the prospect of a huge water crisis if the situation is not remedied soon. The city needs over 3,324 million litres of water a day (MLD) while it gets just over 2,000 MLD. The average water consumption in Delhi is estimated at 240-litre per capita per day (lpcd), the highest in the country,” added Mr. Jain.
Rapid Rate of Population
Admitting that Delhi has been facing rapid decline in groundwater levels in the recent years, which calls for attention and close watch through monitoring the CGWB in its year book 2011-12, the Board has noted that Delhi’s rapid increase in population, at the rate of 2.1 per cent per annum during the decade 2001-2011, has taken a toll. Delhi has total area of 1,484 sq km, of which fully developed urban area is 525 sq km. With over 14 million inhabitants, the city is bursting at seams.
Less Replenishment of Water
"Construction over the years has affected water recharge as natural drainages have disappeared. Besides, more concrete means less amount of rainwater can seep through the earth," the official said.

Source:http://indiatoday.intoday.in/story/delhi-groundwater-reserves-depleting-fast-cgb-study/1/200575
Figure 9: sinking of water table
From above discussion we can see that there are some states which are in a very dangerous position in their depth of ground water level. Some steps have been taken by the states to recover their situation like Uttarpradesh government take some laws such as “Uttarpradesh Groundwater Conservation, Protection and Development (Management, Control and Regulation) Act, 2010”.
The rapidly declining water level of Delhi is attributed mainly due to rampant urbanization and enhanced groundwater withdrawal and reduction in the available open space for recharge to groundwater. The situation can be improved by adopting rainwater harvesting and artificial recharge to groundwater measures. The Master plan for rainwater harvesting and artificial recharge of NCT Delhi estimated that nearly 440 MCM of rainwater can be harvested annually in Delhi and utilized for artificial recharge to groundwater. The artificial recharge to groundwater can be taken up by adopting 10different measures like rainwater harvesting at the level of individuals, at the level of colonies and by the institutions. The Central Groundwater Board of NCT Delhi has taken up the leadership of spearheading rainwater harvesting in NCT Delhi. The rainwater harvesting effort by CGWB in JNU and IIT campuses resulted in to rise in water level to the tune of about 2 to 3 meters in vicinity of the area where the project was implemented.
To delay the transplanting to save lot of water, as the evapo-transpiration is much less compared to May, at the initiative of the Punjab State Farmers Commission, ‘the Punjab preservation of sub-soil water Act, 2009’ was promulgated as an Ordinance in 2008.
A Rajasthan State Sector Scheme “Artificial Recharge to Ground Water through Dug Wells” of Ministry of Water Resources was implemented in 31 districts of Rajasthan during 2007-2010. Under this scheme, funds to the tune of Rs. 29.80 crore were released through NABARD covering 88753 beneficiaries for construction of dug well recharge structures in their farm land.
References:
- Banerjee, B(1983), “Social networks in the migration process : Empirical Evidence on Chain Migration in India.”, The Journal of developing areas, Vol. 17
- Chopra, K and Gulati, S.C ( 2001), “Migration, Common Property Resources and Environmental Degradation”. Sage, New Delhi
- Ministry of water resources, Government of India, Central Water Commission ‘Groundwater Monitoring Report 2016’
- Bagchi et.all (2005) “Growth and structural changes in the economy of Gujarat, 1970-2000”
- Ground water Year Book 2015, Central Groundwater Board, Western Rajasthan.
*Student, 2016
Part -Time Lecturer in the Department of Geography of Women’s Christian College


Comments
Post a Comment